7th Grade Random Sampling and Inference Quiz: 10 Questions with Explanations

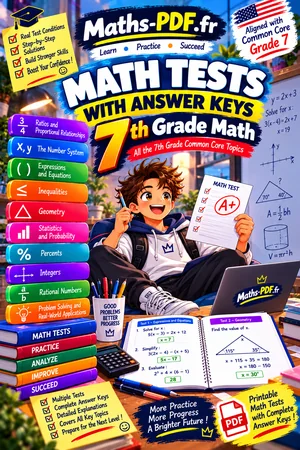
This random sampling quiz for 7th Grade covers random sampling and inference (Common Core 7.SP.A.1, 7.SP.A.2), with a free PDF to print.
Answer all 10 multiple-choice questions on populations and samples, representative and biased samples, random sampling, and using samples to estimate a population. Pick the single best answer, then read the explanation to see why it is right and which common mistake each wrong choice shows. A score of 8 or more means you are ready for the test.
Grade 7 · Common Core State Standards: 7.SP.A.1, 7.SP.A.2
Random sampling quiz: 10 questions
Remember
- A population is the whole group; a sample is a part of it.
- A random sample gives every member an equal chance of being chosen.
- Biased samples over-represent some members and give poor estimates.
- Estimate a population count by multiplying the sample proportion by the population size.
- Larger random samples vary less and give better estimates.
How to use this random sampling quiz
Answer each question, read the explanation that appears, and keep track of your score. A score of 8 out of 10 or more means you are ready for the test.
Download the random sampling quiz as a PDF with the button below and keep it with your notes.
All Grade 7 chapters: Grade 7 math.
Free printable PDF
7th Grade Random Sampling and Inference Quiz: 10 Questions with Explanations
Download PDF
More 7th Grade math
Lessons
See all





Worksheets
See all



Tests
See all Circumference and Area of Circles Test with Point Values
- Solving Two-Step Equations Test with Point Values
- Random Sampling and Inference Test with Point Values
- Comparing Two Populations Test with Point Values
- Drawing Triangles from Given Conditions Test with Point Values
- Compound Events and Simulations Test with Point Values