2nd Grade Picture Graphs, Bar Graphs and Line Plots Worksheet (PDF)

This grade 2 data worksheet for 2nd Grade covers picture graphs, bar graphs and line plots (Common Core 2.MD.D.9, 2.MD.D.10), with a free PDF to print.
These 24 problems practice measuring in inches, making and reading line plots, and reading picture graphs and bar graphs with up to four categories (standards 2.MD.D.9 and 2.MD.D.10).
Read the key or the scale first. Add to put groups together and subtract to compare. The last six problems use more than one step.
Grade 2 · Common Core State Standards: 2.MD.D.9, 2.MD.D.10
Grade 2 data worksheet: exercises 1 to 10
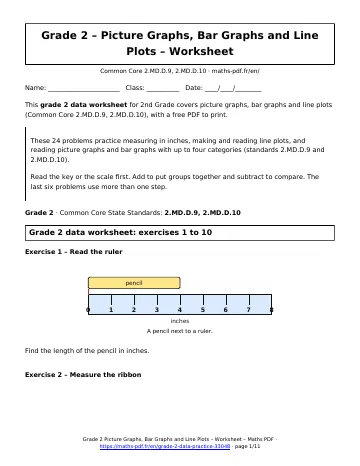
Exercise 1 – Read the ruler
Find the length of the pencil in inches.
Exercise 2 – Measure the ribbon
How long is the ribbon?
Exercise 3 – Shells that are 5 inches
How many shells are 5 inches long?
Exercise 4 – Count all the shells
How many shells did Mei measure in all?
Exercise 5 – Longest and shortest
What is the length of the longest shell? What is the length of the shortest shell?
Exercise 6 – Shorter than 5 inches
How many shells are shorter than 5 inches?
Exercise 7 – Make a line plot
Jamal measured 10 ribbons in inches: 6, 4, 5, 6, 7, 4, 6, 5, 6, 3. Make a line plot with the numbers 3 to 7. Then tell how many ribbons are 6 inches long.
Exercise 8 – Most popular game
Which game did the most children choose?
Exercise 9 – Count one row
How many children chose tag?
Exercise 10 – Kickball and jump rope
How many more children chose kickball than jump rope?
Exercises 11 and up
Exercise 11 – All the children
How many children answered the question in all?
Exercise 12 – Read the bar
How many cats are in the graph?
Exercise 13 – Fewest pets
Which pet has the shortest bar? How many are there?
Exercise 14 – Dogs and birds
How many more dogs than birds are there?
Exercise 15 – Cats and fish
How many cats and fish are there together?
Exercise 16 – Fewer fish
How many fewer fish than dogs are there?
Exercise 17 – Draw a bar graph
| Saturday activity | Children |
|---|---|
| Soccer | 5 |
| Swim | 7 |
| Art | 4 |
| Chess | 2 |
Draw a bar graph for the table. Then find how many more children chose swim than art.
Exercise 18 – Not dogs
Every pet in the graph is a dog, a cat, a fish or a bird. How many pets are not dogs?
Exercise 19 – Five inches or longer
How many shells are 5 inches or longer?
Exercise 20 – Sprout heights
Priya measured 10 bean sprouts in inches: 2, 3, 3, 4, 3, 5, 2, 3, 4, 3. Make a line plot with the numbers 2 to 5. How many more sprouts are 3 inches tall than 5 inches tall?
Exercise 21 – Weather days
Were there more sunny days, or more rainy and snowy days together? How many more?
Exercise 22 – Cupcake sale
How many cupcakes were sold in all four days? How many more were sold on Thursday than on Monday?
Exercise 23 – Days without sun
How many days were not sunny?
Exercise 24 – Recess changes
Two children move from Four square to Jump rope. How many children play Jump rope now? Which game has the most children now?

Key facts behind this grade 2 data worksheet
- Measure to the nearest whole inch, starting at the 0 mark of the ruler.
- On a line plot, each X is one object.
- Read the key of a picture graph before you count.
- A bar graph uses the scale on the side to give the number for each bar.
- Put together by adding. Compare by subtracting.
How to use this grade 2 data worksheet
Work through the exercises in order: they go from simple to challenging. Write every step on paper, then compare with the solutions page and redo any exercise you missed the next day.
Download the grade 2 data worksheet as a PDF with the button below and keep it with your notes.
Download the grade 2 data worksheet as a PDF with the button below and keep it with your notes.
All Grade 2 chapters: Grade 2 math.
More 2nd Grade math
Lessons
See all



Worksheets
See all


Tests
See all Fluency Within 20, Even and Odd Numbers Test with Point Values
- Shapes and Equal Shares Test with Point Values
- Arrays and Equal Groups Test with Point Values
- Telling Time to Five Minutes Test with Point Values
- Money: Dollars and Coins Test with Point Values
- Picture Graphs, Bar Graphs and Line Plots Test with Point Values