2nd Grade Picture Graphs, Bar Graphs and Line Plots Quiz: 10 Questions with Answers
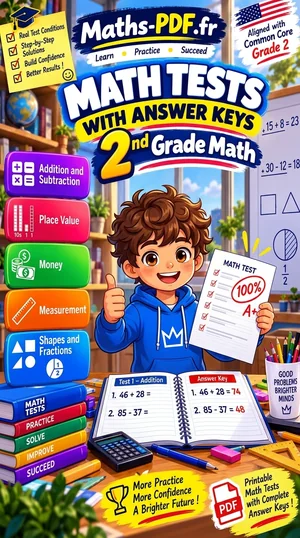
This 2nd grade bar graphs quiz covers picture graphs, bar graphs and line plots (Common Core 2.MD.D.9, 2.MD.D.10), with a free PDF to print.
Key takeaway: This quiz helps Grade 2 students check what they know about measuring and graphs.
- Topic: Picture Graphs, Bar Graphs and Line Plots (2nd grade)
- Content: 10 multiple-choice questions with instant explanations
- Standards: 2.MD.D.9, 2.MD.D.10
- Answers: Explanations included
- Format: Free printable PDF, US Letter, black and white
This quiz helps Grade 2 students check what they know about measuring and graphs. It is a short multiple choice review that fits into a few minutes of class time or practice at home.
The quiz has 10 questions. First, students read a line plot of twigs, compare favorite activities, and add apples picked each day. Then they measure a strip, add dogs and cats from a bar graph, and read Xs on a line plot. Finally, they subtract in a picture graph, name the graph that uses bars, and place the 0 mark of a ruler. Read titles and keys carefully.
Answer these 10 questions about measuring, line plots, picture graphs and bar graphs. Pick the one best answer. Read each graph slowly, and check the key or scale first.
Grade 2 · Common Core State Standards: 2.MD.D.9, 2.MD.D.10
2nd grade bar graphs quiz: 10 questions
Question 6 and after
Remember
- Measure to the nearest whole inch, starting at the 0 mark of the ruler.
- Next, on a line plot, each X is one object.
- Read the key of a picture graph before you count.
- Then, a bar graph uses the scale on the side to give the number for each bar.
- Put together by adding. Compare by subtracting.
Common mistakes with this 2nd grade bar graphs quiz
- On a line plot, students count the number on the line instead of the Xs. The number tells the length, and the Xs tell how many objects have that length.
- When a question asks how many in all, students subtract. Instead, add the numbers from the bars or rows.
- Also, when measuring, students put the 0 mark at the wrong end. The 0 mark lines up with one end of the object.
Tips to get a high score
- Look at the title and labels first. They tell you what the graph shows and what each picture or bar means.
- Next, underline the question words in all and how many more. They tell you whether to add or subtract.
- Also, teachers can use the quiz with a graph on the board. Then students vote on answers first and explain how they know.
Download the 2nd grade bar graphs quiz as a PDF with the button below and keep it with your notes.
2nd grade bar graphs quiz: frequently asked questions
Which graph uses bars to show data?
A bar graph uses bars. The taller the bar, the greater the number. A picture graph uses small pictures, and a line plot uses Xs above a number line. Only a bar graph uses a scale on the side.
How do you find how many children are not in one group?
Subtract the group from the total. For example, if 15 children are in a picture graph and 9 chose soccer, then 15 – 9 did not choose soccer. You can check by adding.
Where does the zero mark of a ruler go?
Place the 0 mark at one end of the object, with the object lying straight along the ruler. Then read the number at the other end. Then, make sure the edge of the ruler lines up with the end of the object.
All Grade 2 chapters: Grade 2 math.
Free printable PDF
2nd Grade Picture Graphs, Bar Graphs and Line Plots Quiz: 10 Questions with Answers
Download PDF
More 2nd Grade math
Lessons
See all Fluency Within 20, Even and Odd Numbers Lesson: Notes and Examples
- Arrays and Equal Groups Lesson: Notes and Examples
- Telling Time to Five Minutes Lesson: Notes and Examples
- Money: Dollars and Coins Lesson: Notes and Examples
- Adding and Subtracting Within 1,000 Lesson: Notes and Examples
- Skip Counting and Comparing Numbers Lesson: Notes and Examples



Worksheets
See all- Adding Within 100 Worksheets with Answers
- Arrays and Equal Groups Worksheets with Answers
- Fluency Within 20, Even and Odd Numbers Worksheets with Answers
- Money: Dollars and Coins Worksheets with Answers
- Shapes and Equal Shares Worksheets with Answers
- Skip Counting and Comparing Numbers Worksheets with Answers


Tests
See all

Quizzes
See all- One- and Two-Step Word Problems Quiz: 10 Questions with Answers
- Adding Within 100 Quiz: 10 Questions with Answers
- Money: Dollars and Coins Quiz: 10 Questions with Answers
- Shapes and Equal Shares Quiz: 10 Questions with Answers
- Telling Time to Five Minutes Quiz: 10 Questions with Answers
- Arrays and Equal Groups Quiz: 10 Questions with Answers