2nd Grade Picture Graphs, Bar Graphs and Line Plots Lesson (Free PDF)

This grade 2 data lesson for 2nd Grade covers picture graphs, bar graphs and line plots (Common Core 2.MD.D.9, 2.MD.D.10), with a free PDF to print.
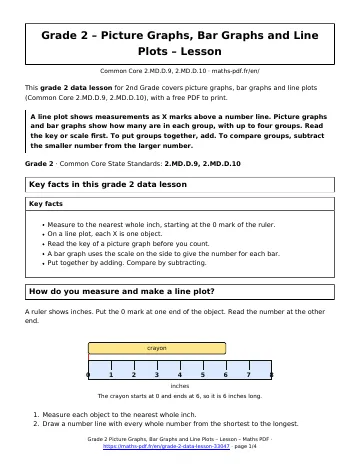
A line plot shows measurements as X marks above a number line. Picture graphs and bar graphs show how many are in each group, with up to four groups. Read the key or scale first. To put groups together, add. To compare groups, subtract the smaller number from the larger number.
Grade 2 · Common Core State Standards: 2.MD.D.9, 2.MD.D.10
Key facts in this grade 2 data lesson
- Measure to the nearest whole inch, starting at the 0 mark of the ruler.
- On a line plot, each X is one object.
- Read the key of a picture graph before you count.
- A bar graph uses the scale on the side to give the number for each bar.
- Put together by adding. Compare by subtracting.
How do you measure and make a line plot?
A ruler shows inches. Put the 0 mark at one end of the object. Read the number at the other end.
- Measure each object to the nearest whole inch.
- Draw a number line with every whole number from the shortest to the longest.
- Put one X above the number for each object.
Example: Zoe measured 10 leaves. Three leaves are 5 inches long, so there are 3 X marks above 5.
How do you read a picture graph?
A picture graph uses a small picture for each thing counted. Read the key first. In our graph, each circle means 1 child. Count the circles in a row to get the number.
How do you read a bar graph?
A bar graph uses bars. The numbers on the side are the scale. Find the top of a bar, then look across to the number. The corn bar reaches 8, so 8 baskets of corn were sold.
How do you answer put-together and compare questions?
To put together, add the numbers. To compare, subtract the smaller number from the bigger number.
Put together: bus and walk riders are \(9 + 6 = 15\) children.
Compare: how many more ride the bus than bike? \(9 – 4 = 5\) children.
What mistakes should you avoid?
- Do not start measuring at the edge of the ruler if the 0 mark is a little farther in.
- Do not forget the key. A circle might mean 1 child, not 2.
- Do not add when the question says how many more. Subtract instead.
- Check your answer by counting the marks again.
Grade 2 data lesson: questions and answers
What is a line plot?
A line plot is a number line with X marks above it. Each X shows one measurement. It helps us see which length happens most often.
How is a picture graph different from a bar graph?
A picture graph shows each item as a small picture. A bar graph shows each group as one bar and uses a number scale. Both show how many are in each group.
How do I find how many more?
Subtract the smaller number from the larger number. If 9 children ride the bus and 4 ride bikes, then 9 – 4 = 5 more children ride the bus.
Where do I put the 0 of the ruler when I measure?
Line up the 0 mark with one end of the object. Then read the number at the other end. Do not start at the edge of the ruler if it is not marked 0.
How many categories do the graphs have in Grade 2?
Grade 2 graphs have up to four categories. That keeps the graph easy to read while you practice adding and subtracting.
How to use this grade 2 data lesson
Read the definitions first, then follow the worked method line by line and redo the example on paper without looking. When every step makes sense, move on to the worksheet, then check yourself with the quiz.
Download the grade 2 data lesson as a PDF with the button below and keep it with your notes.
All Grade 2 chapters: Grade 2 math.
Print this page
Download PDFDownload the 2nd Grade Picture Graphs, Bar Graphs and Line Plots Lesson (PDF, 61 KB)More 2nd Grade math
Lessons
See all

Worksheets
See all

Tests
See all Skip Counting and Comparing Numbers Test with Point Values
- Picture Graphs, Bar Graphs and Line Plots Test with Point Values
- One- and Two-Step Word Problems Test with Point Values
- Arrays and Equal Groups Test with Point Values
- Adding and Subtracting Within 1,000 Test with Point Values
- Measuring Length Test with Point Values