7th Grade Random Sampling and Inference Lesson (Free PDF)
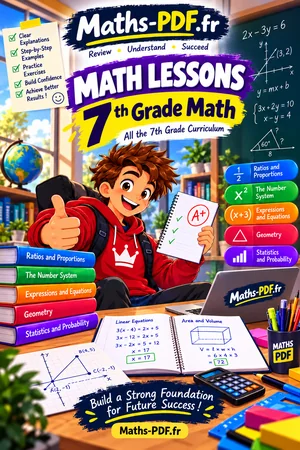
This random sampling lesson for 7th Grade covers random sampling and inference (Common Core 7.SP.A.1, 7.SP.A.2), with a free PDF to print.
A population is the whole group being studied, and a sample is a part of it. A random sample gives every member an equal chance of being chosen, so it is usually representative of the population. You can use the proportion in a random sample to estimate the proportion in the population, but different samples give somewhat different results.
Grade 7 · Common Core State Standards: 7.SP.A.1, 7.SP.A.2
Key facts in this random sampling lesson
- A population is the whole group; a sample is a part of it.
- A random sample gives every member an equal chance of being chosen.
- Biased samples over-represent some members and give poor estimates.
- Estimate a population count by multiplying the sample proportion by the population size.
- Larger random samples vary less and give better estimates.
What are a population and a sample?
A population is the whole group you want to learn about. A sample is a part of the population that you actually measure or survey.
Surveying every student in a school of 600 takes a long time, so a class might survey just 40 and use the results to make an inference, a conclusion about the whole population.
What makes a sample representative?
Asking only the basketball team about favorite sports gives a biased sample, because team members may like basketball more than other students do. Drawing names from a hat, or using a random number generator, avoids that bias.
How do you use a sample to estimate a population?
Find the proportion in the sample and apply it to the population.
- Find the sample proportion: \(50 \div 200 = 0.25\).
- Multiply by the population size: \(0.25 \times 1200 = 300\).
- Say it is an estimate, not an exact count.
Why do different samples give different results?
Each random sample is a little different, which is called sampling variability. If you draw many samples of the same size, the results cluster around the true value. Larger samples vary less, so they give better estimates.
The dot plot shows 12 samples. The center is near 26%, so an estimate close to 26% is reasonable even though single samples ranged from 22% to 31%.
Random sampling lesson: questions and answers
What is the difference between a population and a sample?
The population is everyone or everything you want to study. A sample is a smaller group chosen from the population.
What makes a sample biased?
A sample is biased when some members of the population are more likely to be chosen than others. Asking only the basketball team about sports is biased.
How do you pick a random sample?
Use a method that gives every member an equal chance, such as drawing names from a hat or using a random number generator.
How do you estimate a population from a sample?
Find the proportion in the sample and multiply it by the population size. If \(25\%\) of a sample likes pizza, expect about \(25\%\) of \(1,200\) students, or 300.
Why do two random samples give different results?
Chance causes small differences between samples. This is called sampling variability, and it is smaller for larger samples.
How to use this random sampling lesson
Read the definitions first, then follow the worked method line by line and redo the example on paper without looking. When every step makes sense, move on to the worksheet, then check yourself with the quiz.
Download the random sampling lesson as a PDF with the button below and keep it with your notes.
All Grade 7 chapters: Grade 7 math.

More 7th Grade math
Lessons
See all


Worksheets
See all


Tests
See all Solving Two-Step Equations Test with Point Values
- Area, Volume and Surface Area Test with Point Values
- Percent Problems: Tax, Tips, Discounts and Markups Test with Point Values
- Compound Events and Simulations Test with Point Values
- Cross-Sections of Three-Dimensional Figures Test with Point Values
- Unit Rates with Fractions Test with Point Values