1st Grade Organizing and Reading Data Test with Point Values (PDF)

This grade 1 data test for 1st Grade covers organizing and reading data (Common Core 1.MD.C.4), with a free PDF to print.
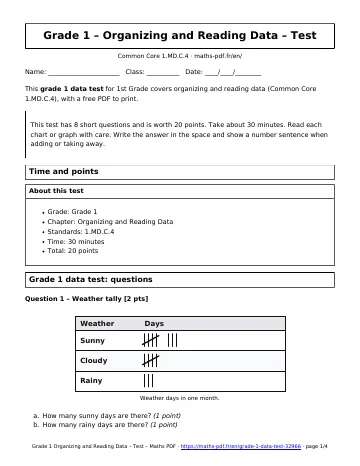
This test has 8 short questions and is worth 20 points. Take about 30 minutes. Read each chart or graph with care. Write the answer in the space and show a number sentence when adding or taking away.
Time and points
- Grade: Grade 1
- Chapter: Organizing and Reading Data
- Standards: 1.MD.C.4
- Time: 30 minutes
- Total: 20 points
Grade 1 data test: questions
Question 1 – Weather tally [2 pts]
- How many sunny days are there? (1 point)
- How many rainy days are there? (1 point)
Question 2 – Draw tally marks [2 pts]
Draw tally marks to show 12. (1 point)
How many groups of five are in the drawing? (1 point)
Question 3 – Recess toys [3 pts]
- Which toy did the most children choose? (1 point)
- How many more children chose chalk than rope? (1 point)
- How many children are in the graph in all? (1 point)
Question 4 – Pizza toppings [3 pts]
- How many children chose mushroom? (1 point)
- How many fewer children chose pepper than cheese? (1 point)
- How many children chose cheese or pepper? (1 point)
Question 5 – Crayon box [2 pts]
A box has 5 red crayons and 7 blue crayons. The rest are green. There are 18 crayons in all. How many are green? Write a number sentence and the answer.
Question 6 – Vehicle graph [3 pts]
Ethan counted 4 trucks, 6 cars, and 3 bikes. Draw a picture graph. Use one circle for each vehicle. (2 points)
How many more cars than trucks are there? (1 point)
Question 7 – Library books [3 pts]
Write true or false for each sentence.
- 5 more children picked animal books than space books. (1 point)
- Sports books got fewer votes than space books. (1 point)
- 18 books were checked out in all. (1 point)
Question 8 – Playground votes [2 pts]
11 children voted for a playground toy. 5 chose swings and 4 chose the slide. The rest chose the seesaw. How many chose the seesaw? (1 point)
Which toy got the most votes? (1 point)
Key facts behind this grade 1 data test
- Data is information we collect, such as votes.
- A tally mark is one line for one vote, and every fifth line crosses four lines.
- In a picture graph, each picture stands for one vote.
- In a bar graph, a taller bar means more votes.
- Add to find the total. Take away to find how many more or how many fewer.
How to use this grade 1 data test
Time yourself: the test is designed for an average student in 45 minutes. Answer the questions you are sure of first, then come back to the longer ones and check your units.
All Grade 1 chapters: Grade 1 math.