Algebra 1 Data Distributions and Summary Statistics Lesson (Free PDF)
This data distributions lesson for Algebra 1 covers data distributions and summary statistics (Common Core S-ID.A.1, S-ID.A.2, S-ID.A.3), with a free PDF to print.
Data can be displayed in dot plots, histograms, and box plots. The mean and median describe the center, while the range, interquartile range, and standard deviation describe the spread. An outlier is an unusually large or small value. Describe a distribution by its shape, center, spread, and outliers, and compare data sets in context.
Algebra 1 · Common Core State Standards: S-ID.A.1, S-ID.A.2, S-ID.A.3
Key facts in this data distributions lesson
- Dot plots show every value; histograms group data into intervals; box plots show five numbers.
- Mean = sum ÷ count; median = middle value.
- IQR = Q3 – Q1; range = maximum – minimum.
- Outlier rule: below Q1 – 1.5·IQR or above Q3 + 1.5·IQR.
- With outliers or skew, the median and IQR are better summaries than the mean and standard deviation.
How do you display data?
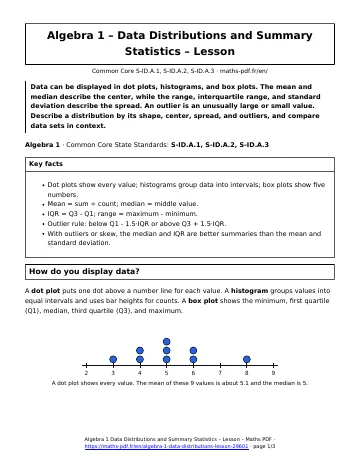
A dot plot puts one dot above a number line for each value. A histogram groups values into equal intervals and uses bar heights for counts. A box plot shows the minimum, first quartile (Q1), median, third quartile (Q3), and maximum.
How do you measure the center?
The mean is the sum of the values divided by how many there are. The median is the middle value when the data are in order. For \(3, 4, 4, 5, 5, 5, 6, 6, 8\), the mean is \(\frac{46}{9} \approx 5.1\) and the median is 5. An extreme value pulls the mean but barely moves the median.
- Order the data from least to greatest and find the median.
- Find Q1 as the median of the lower half and Q3 as the median of the upper half.
- Compute the IQR and draw the box from Q1 to Q3 with a line at the median.
Example: For 12, 15, 17, 20, 22, 26, 31, the median is 20, Q1 is 15, Q3 is 26, and the IQR is \(26 – 15 = 11\).
What is an outlier?
A common rule says a value is an outlier if it is more than \(1.5\) IQRs below Q1 or above Q3. The fences are \(Q1 – 1.5 \cdot \text{IQR}\) and \(Q3 + 1.5 \cdot \text{IQR}\). If the data have an outlier, the median and IQR describe the data better than the mean and standard deviation.
How do you describe a distribution?
Describe the shape (symmetric, skewed left, or skewed right), the center, the spread, and any unusual values, always in context. When comparing two groups, compare these features side by side.
Data distributions lesson: questions and answers
What is the difference between mean and median?
The mean is the sum divided by the count. The median is the middle value of the ordered data. Outliers change the mean much more than the median.
How do you find the interquartile range?
Find Q1, the median of the lower half, and Q3, the median of the upper half. Then subtract: IQR = Q3 – Q1.
What does standard deviation tell you?
It tells how far values typically are from the mean. A larger standard deviation means the data are more spread out.
How do you decide if a value is an outlier?
Compute the fences Q1 – 1.5·IQR and Q3 + 1.5·IQR. Any value outside the fences is an outlier.
When should you use the median instead of the mean?
Use the median when the distribution is skewed or has outliers, such as incomes or house prices, because the mean is pulled toward the extreme values.
How to use this data distributions lesson
Read the definitions first, then follow the worked method line by line and redo the example on paper without looking. When every step makes sense, move on to the worksheet, then check yourself with the quiz.
Download the data distributions lesson as a PDF with the button below and keep it with your notes.
Download the data distributions lesson as a PDF with the button below and keep it with your notes.
All Algebra 1 chapters: Algebra 1 math.
More Algebra 1 math
Lessons
See all



Worksheets
See all




Tests
See all Arithmetic and Geometric Sequences Test with Point Values
- Solving Quadratic Equations Test with Point Values
- Slope and Rate of Change Test with Point Values
- Data Distributions and Summary Statistics Test with Point Values
- Structure of Algebraic Expressions Test with Point Values
- Writing Linear Equations and Functions Test with Point Values