Algebra 1 Scatter Plots, Lines of Fit and Two-Way Tables Lesson (Free PDF)

This algebra 1 scatter plots lesson for Algebra 1 covers scatter plots, lines of fit and two-way tables (Common Core S-ID.B.5, S-ID.B.6, S-ID.C.7, S-ID.C.8, S-ID.C.9), with a free PDF to print.
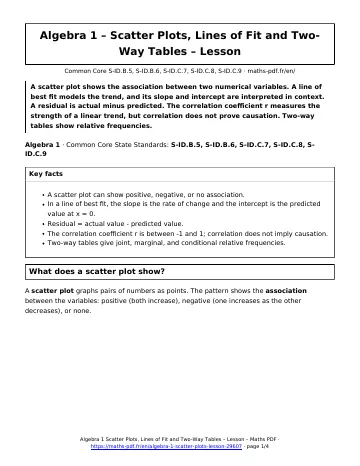
A scatter plot shows the association between two numerical variables. A line of best fit models the trend, and its slope and intercept are interpreted in context. A residual is actual minus predicted. The correlation coefficient r measures the strength of a linear trend, but correlation does not prove causation. Two-way tables show relative frequencies.
Algebra 1 · Common Core State Standards: S-ID.B.5, S-ID.B.6, S-ID.C.7, S-ID.C.8, S-ID.C.9
Key facts in this algebra 1 scatter plots lesson
- A scatter plot can show positive, negative, or no association.
- In a line of best fit, the slope is the rate of change and the intercept is the predicted value at x = 0.
- Residual = actual value – predicted value.
- The correlation coefficient r is between -1 and 1; correlation does not imply causation.
- Two-way tables give joint, marginal, and conditional relative frequencies.
What does a scatter plot show?
A scatter plot graphs pairs of numbers as points. The pattern shows the association between the variables: positive (both increase), negative (one increases as the other decreases), or none.
How do you use a line of fit?
A line of best fit is a line that follows the trend. Its equation \(y = mx + b\) can predict values. For the study data, \(y = 6.4x + 45.4\): each additional hour of studying is associated with about 6.4 more points, and 45.4 is the predicted score for 0 hours.
- Decide whether a linear model fits the pattern.
- Write the equation of the line, using technology or two points on the line.
- Interpret the slope as the rate of change and the intercept as the starting value, in context.
- Predict only within the range of the data. Predicting far outside it is extrapolation and can be unreliable.
What is a residual?
A residual is the actual value minus the predicted value. If a student studied 4 hours and scored 70, the predicted score is \(6.4(4) + 45.4 = 71\) and the residual is \(70 – 71 = -1\). A residual plot with no pattern supports a linear model.
What does the correlation coefficient measure?
The correlation coefficient \(r\) is between \(-1\) and 1. Its sign gives the direction, and its size gives the strength of the linear relationship. Correlation does not prove causation: ice cream sales and sunburns both rise in summer because of hot weather, a lurking variable.
How do two-way tables work?
A two-way table shows counts for two categorical variables. The joint relative frequency divides a cell by the grand total, the marginal relative frequency divides a row or column total by the grand total, and the conditional relative frequency divides a cell by its row or column total.
In the table, the joint frequency for grade 8 and bike is \(\frac{40}{100} = 40\%\). Among grade 8 students, the conditional frequency of biking is \(\frac{40}{50} = 80\%\).
Algebra 1 scatter plots lesson: questions and answers
What is a line of best fit?
It is a straight line that follows the trend of a scatter plot closely, with points above and below it. It is used to describe and predict the relationship.
How do you interpret the slope of a line of best fit?
It is the predicted change in y for each 1-unit increase in x. For y = 6.4x + 45.4 with hours studied, each extra hour predicts 6.4 more points.
What does a residual tell you?
A residual is actual minus predicted. A positive residual means the point is above the line, and a negative residual means it is below.
Does a strong correlation prove causation?
No. Two variables can move together because of a lurking variable or by chance. Only a well-designed experiment can show cause and effect.
What is a conditional relative frequency?
It is a count divided by a row or column total, not the grand total. For example, 40 of the 50 grade 8 students bike, so the conditional frequency is 80%.
How to use this algebra 1 scatter plots lesson
Read the definitions first, then follow the worked method line by line and redo the example on paper without looking. When every step makes sense, move on to the worksheet, then check yourself with the quiz.
Download the algebra 1 scatter plots lesson as a PDF with the button below and keep it with your notes.
Download the algebra 1 scatter plots lesson as a PDF with the button below and keep it with your notes.
All Algebra 1 chapters: Algebra 1 math.
More Algebra 1 math
Lessons
See all





Worksheets
See all





Tests
See all Adding, Subtracting and Multiplying Polynomials Test with Point Values
- Exponential Functions and Growth Test with Point Values
- Graphing Linear Equations Test with Point Values
- Data Distributions and Summary Statistics Test with Point Values
- Solving Linear Equations in One Variable Test with Point Values
- Graphing Quadratic Functions and Transformations Test with Point Values