Algebra 1 Linear Inequalities in Two Variables and Systems Lesson (Free PDF)

This linear inequalities two variables lesson for Algebra 1 covers linear inequalities in two variables and systems (Common Core A-REI.D.12, A-CED.A.3), with a free PDF to print.
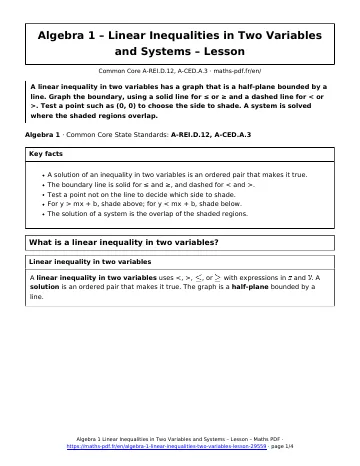
A linear inequality in two variables has a graph that is a half-plane bounded by a line. Graph the boundary, using a solid line for ≤ or ≥ and a dashed line for < or >. Test a point such as (0, 0) to choose the side to shade. A system is solved where the shaded regions overlap.
Algebra 1 · Common Core State Standards: A-REI.D.12, A-CED.A.3
Key facts in this linear inequalities two variables lesson
- A solution of an inequality in two variables is an ordered pair that makes it true.
- The boundary line is solid for ≤ and ≥, and dashed for < and >.
- Test a point not on the line to decide which side to shade.
- For y > mx + b, shade above; for y < mx + b, shade below.
- The solution of a system is the overlap of the shaded regions.
What is a linear inequality in two variables?
How do you graph a linear inequality?
- Replace the inequality symbol with = and graph the boundary line.
- Use a solid line for \(\le\) and \(\ge\). Use a dashed line for < and >.
- Test a point not on the line, such as \((0, 0)\).
- Shade the side of the line that contains the solution.
For \(y \le x + 1\), the test point \((0, 0)\) gives \(0 \le 0 + 1\), which is true, so shade the side containing the origin: below the line.
Why is the line solid or dashed?
A solid line says that points on the line are solutions. A dashed line says they are not.
For inequalities in slope-intercept form, \(y > mx + b\) means shade above the line and \(y < mx + b\) means shade below. If you multiply or divide by a negative number, reverse the symbol.
How do you graph a system of inequalities?
Graph each inequality on the same plane. The solution is the region where all the shaded regions overlap. A corner of the region is found where two boundary lines meet.
Example: The point \((3, 2)\) is a solution of the system \(y > x – 1\) and \(y \le -x + 4\), because \(2 > 3 – 1\) and \(2 \le -3 + 4\).
How do you use inequalities in a real situation?
Real constraints often limit two quantities. If sandwiches cost $4 and drinks cost $2 and the budget is $20, then \(4x + 2y \le 20\). Only points with whole, nonnegative coordinates make sense in the shaded region.
Linear inequalities two variables lesson: questions and answers
When is the boundary line dashed?
Use a dashed line when the inequality is strict (< or >), because points on the line do not make the statement true.
How do you decide which side to shade?
Pick a test point that is not on the line, usually (0, 0). If it makes the inequality true, shade its side; otherwise shade the other side.
What does the shaded region represent?
Every point in the shaded region is a solution of the inequality, and every solution is in the region (or on a solid boundary).
How do you solve a system of inequalities?
Graph each inequality on the same coordinate plane. The solution set is the region where all the shaded areas overlap.
Why do word problems often use only part of the region?
Quantities such as tickets or hours cannot be negative, and many must be whole numbers, so only some points in the region fit the situation.
How to use this linear inequalities two variables lesson
Read the definitions first, then follow the worked method line by line and redo the example on paper without looking. When every step makes sense, move on to the worksheet, then check yourself with the quiz.
Download the linear inequalities two variables lesson as a PDF with the button below and keep it with your notes.
All Algebra 1 chapters: Algebra 1 math.
Print this page
Download PDFDownload the Algebra 1 Linear Inequalities in Two Variables and Systems Lesson (PDF, 67 KB)More Algebra 1 math
Lessons
See all





Worksheets
See all





Tests
See all Scatter Plots, Lines of Fit and Two-Way Tables Test with Point Values
- Systems of Linear Equations Test with Point Values
- Exponent Rules and Radicals Test with Point Values
- Literal Equations and Formulas Test with Point Values
- Linear Inequalities in One Variable Test with Point Values
- Linear Inequalities in Two Variables and Systems Test with Point Values