Algebra 1 Data Distributions and Summary Statistics Worksheet (PDF)

This data distributions worksheet for Algebra 1 covers data distributions and summary statistics (Common Core S-ID.A.1, S-ID.A.2, S-ID.A.3), with a free PDF to print.
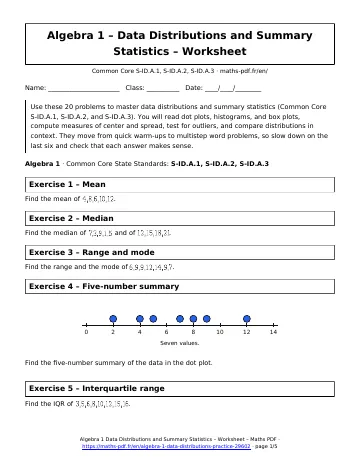
Algebra 1 · Common Core State Standards: S-ID.A.1, S-ID.A.2, S-ID.A.3
Data distributions worksheet: exercises 1 to 10
Exercise 1 – Mean
Exercise 2 – Median
Exercise 3 – Range and mode
Exercise 4 – Five-number summary
Find the five-number summary of the data in the dot plot.
Exercise 5 – Interquartile range
Exercise 6 – Draw a box plot
Exercise 7 – Read a dot plot
The dot plot shows the number of pets owned by 9 students. Find the median and the mode.
Exercise 8 – Read a histogram
The histogram shows minutes spent on homework by 25 students. How many students spent less than 30 minutes? What percent is that?
Exercise 9 – Shape of a distribution
The histogram shows dollars spent at a school store. Describe the shape.
Exercise 10 – Test for outliers
Exercises 11 and up
Exercise 11 – Effect of an outlier
Exercise 12 – Standard deviation
Exercise 13 – Standard deviation with a calculator
Exercise 14 – Compare two data sets
Team A scores \(10, 12, 14, 16, 18\) and Team B scores \(6, 10, 14, 18, 22\). Compare the means and standard deviations (nearest tenth).
Exercise 15 – Best measure of center
The prices of a pizza at five shops are $9, $10, $10, $11, and $25. Find the mean and the median. Which better describes a typical price?
Exercise 16 – Test scores
Nine students scored \(72, 75, 78, 80, 82, 85, 88, 90, 98\). Find the mean (nearest tenth), the median, and the IQR.
Exercise 17 – Race times
The histogram shows the 100-meter dash times of 23 runners in intervals of 1 second. About what fraction of runners finished in under 14 seconds?
Exercise 18 – Compare box plots
The box plots show the quiz scores for Class A and Class B. Compare the medians, IQRs, and ranges.
Exercise 19 – Daily steps
A student’s daily steps (in thousands) for 9 days are \(6, 7, 7, 8, 8, 9, 9, 10, 31\). Use the IQR rule to find any outlier, and say which statistics you would report.
Exercise 20 – Change every value
Key facts behind this data distributions worksheet
- Dot plots show every value; histograms group data into intervals; box plots show five numbers.
- Mean = sum ÷ count; median = middle value.
- IQR = Q3 – Q1; range = maximum – minimum.
- Outlier rule: below Q1 – 1.5·IQR or above Q3 + 1.5·IQR.
- With outliers or skew, the median and IQR are better summaries than the mean and standard deviation.
How to use this data distributions worksheet
Work through the exercises in order: they go from simple to challenging. Write every step on paper, then compare with the solutions page and redo any exercise you missed the next day.
Download the data distributions worksheet as a PDF with the button below and keep it with your notes.
All Algebra 1 chapters: Algebra 1 math.
Print this page
Download PDFDownload the Algebra 1 Data Distributions and Summary Statistics Worksheet (PDF, 77 KB)More Algebra 1 math
Lessons
See all





Worksheets
See all





Tests
See all Adding, Subtracting and Multiplying Polynomials Test with Point Values
- Structure of Algebraic Expressions Test with Point Values
- Solving Linear Equations in One Variable Test with Point Values
- Solving Quadratic Equations Test with Point Values
- Arithmetic and Geometric Sequences Test with Point Values
- Linear Inequalities in One Variable Test with Point Values