Algebra 1 Data Distributions and Summary Statistics Quiz: 10 Questions with Explanations

This data distributions quiz for Algebra 1 covers data distributions and summary statistics (Common Core S-ID.A.1, S-ID.A.2, S-ID.A.3), with a free PDF to print.
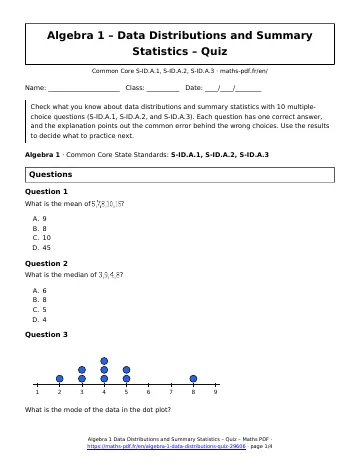
Check what you know about data distributions and summary statistics with 10 multiple-choice questions (S-ID.A.1, S-ID.A.2, and S-ID.A.3). Each question has one correct answer, and the explanation points out the common error behind the wrong choices. Use the results to decide what to practice next.
Algebra 1 · Common Core State Standards: S-ID.A.1, S-ID.A.2, S-ID.A.3
Data distributions quiz: 10 questions
Remember
Remember
- Dot plots show every value; histograms group data into intervals; box plots show five numbers.
- Mean = sum ÷ count; median = middle value.
- IQR = Q3 – Q1; range = maximum – minimum.
- Outlier rule: below Q1 – 1.5·IQR or above Q3 + 1.5·IQR.
- With outliers or skew, the median and IQR are better summaries than the mean and standard deviation.
How to use this data distributions quiz
Answer each question, read the explanation that appears, and keep track of your score. A score of 8 out of 10 or more means you are ready for the test.
Download the data distributions quiz as a PDF with the button below and keep it with your notes.
Download the data distributions quiz as a PDF with the button below and keep it with your notes.
All Algebra 1 chapters: Algebra 1 math.
Print this page
Download PDFDownload the Algebra 1 Data Distributions and Summary Statistics Quiz: 10 Questions with Explanations (PDF, 55 KB)More Algebra 1 math
Lessons
See all





Worksheets
See all





Tests
See all Writing Linear Equations and Functions Test with Point Values
- Graphing Quadratic Functions and Transformations Test with Point Values
- Systems of Linear Equations Test with Point Values
- Linear Inequalities in Two Variables and Systems Test with Point Values
- Scatter Plots, Lines of Fit and Two-Way Tables Test with Point Values
- Functions and Function Notation Test with Point Values