Algebra 1 Graphing Linear Equations Lesson (Free PDF)

This graphing linear lesson for Algebra 1 covers graphing linear equations (Common Core A-REI.D.10, F-IF.C.7a, A-CED.A.2), with a free PDF to print.
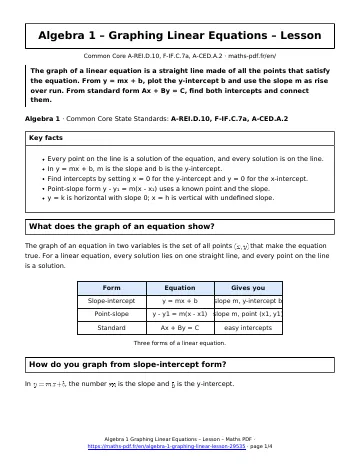
The graph of a linear equation is a straight line made of all the points that satisfy the equation. From y = mx + b, plot the y-intercept b and use the slope m as rise over run. From standard form Ax + By = C, find both intercepts and connect them.
Algebra 1 · Common Core State Standards: A-REI.D.10, F-IF.C.7a, A-CED.A.2
Key facts in this graphing linear lesson
- Every point on the line is a solution of the equation, and every solution is on the line.
- In y = mx + b, m is the slope and b is the y-intercept.
- Find intercepts by setting x = 0 for the y-intercept and y = 0 for the x-intercept.
- Point-slope form y – y₁ = m(x – x₁) uses a known point and the slope.
- y = k is horizontal with slope 0; x = h is vertical with undefined slope.
What does the graph of an equation show?
The graph of an equation in two variables is the set of all points \((x, y)\) that make the equation true. For a linear equation, every solution lies on one straight line, and every point on the line is a solution.
How do you graph from slope-intercept form?
In \(y = mx + b\), the number \(m\) is the slope and \(b\) is the y-intercept.
- Plot the y-intercept \((0, b)\) on the y-axis.
- Use the slope as rise over run to plot a second point.
- Plot a third point as a check and draw a line through them.
How do you graph standard form Ax + By = C?
Find the intercepts. Let \(x = 0\) and solve for \(y\), then let \(y = 0\) and solve for \(x\). For \(3x + 2y = 12\), setting \(x = 0\) gives \(y = 6\), and setting \(y = 0\) gives \(x = 4\).
What about horizontal and vertical lines?
The equation \(y = 3\) is a horizontal line through 3 on the y-axis, with slope 0. The equation \(x = -2\) is a vertical line through -2 on the x-axis, with undefined slope.
How do you graph point-slope form?
For \(y – 1 = 2(x – 3)\), plot the point \((3, 1)\), then use the slope 2 to move up 2 and right 1. Example: \(y + 2 = \frac{1}{2}(x – 4)\) goes through \((4, -2)\) with slope \(\frac{1}{2}\).
Tip: Check every graph with a third point. If you plot the y-intercept and use the slope to find a second point, a third point taken from the equation should land on the same line. Points that are not in a straight line signal an arithmetic slip.
Graphing linear lesson: questions and answers
How do you graph a line from y = mx + b?
Plot the y-intercept (0, b), then move up or down by the rise and right by the run to find another point. Draw a line through the points.
How do you find the x-intercept?
Set y = 0 and solve for x. For 3x + 2y = 12 you get 3x = 12, so the x-intercept is (4, 0).
What does it mean for a point to be on the graph?
Its coordinates make the equation true. Substitute x and y into the equation; if both sides match, the point is on the line.
What is the graph of x = 5?
A vertical line through 5 on the x-axis. Every point on it has x-coordinate 5, and its slope is undefined.
How do you convert standard form to slope-intercept form?
Solve for y. For 6x + 3y = 9, subtract 6x to get 3y = 9 – 6x, then divide by 3 to get y = -2x + 3.
How to use this graphing linear lesson
Read the definitions first, then follow the worked method line by line and redo the example on paper without looking. When every step makes sense, move on to the worksheet, then check yourself with the quiz.
Download the graphing linear lesson as a PDF with the button below and keep it with your notes.
All Algebra 1 chapters: Algebra 1 math.
More Algebra 1 math
Lessons
See all





Worksheets
See all Graphing Linear Equations Worksheet
- Linear Inequalities in Two Variables and Systems Worksheet
- Scatter Plots, Lines of Fit and Two-Way Tables Worksheet
- Linear Inequalities in One Variable Worksheet
- Writing Linear Equations and Functions Worksheet
- Graphing Quadratic Functions and Transformations Worksheet






Tests
See all- Linear Inequalities in One Variable Test with Point Values
- Solving Quadratic Equations Test with Point Values
- Structure of Algebraic Expressions Test with Point Values
- Linear Inequalities in Two Variables and Systems Test with Point Values
- Scatter Plots, Lines of Fit and Two-Way Tables Test with Point Values
- Arithmetic and Geometric Sequences Test with Point Values