Algebra 1 Graphing Quadratic Functions and Transformations Lesson (Free PDF)
This quadratic functions lesson for Algebra 1 covers graphing quadratic functions and transformations (Common Core F-IF.C.7a, F-IF.C.8a, F-BF.B.3, A-SSE.B.3b), with a free PDF to print.
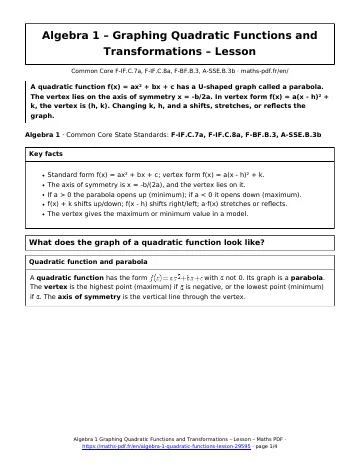
A quadratic function f(x) = ax² + bx + c has a U-shaped graph called a parabola. The vertex lies on the axis of symmetry x = -b/2a. In vertex form f(x) = a(x – h)² + k, the vertex is (h, k). Changing k, h, and a shifts, stretches, or reflects the graph.
Algebra 1 · Common Core State Standards: F-IF.C.7a, F-IF.C.8a, F-BF.B.3, A-SSE.B.3b
Key facts in this quadratic functions lesson
- Standard form f(x) = ax² + bx + c; vertex form f(x) = a(x – h)² + k.
- The axis of symmetry is x = -b/(2a), and the vertex lies on it.
- If a > 0 the parabola opens up (minimum); if a < 0 it opens down (maximum).
- f(x) + k shifts up/down; f(x – h) shifts right/left; a·f(x) stretches or reflects.
- The vertex gives the maximum or minimum value in a model.
What does the graph of a quadratic function look like?
How do you find the vertex and intercepts?
- The axis of symmetry is \(x = -\frac{b}{2a}\). The vertex has this x-coordinate.
- Substitute that x-value to find the y-coordinate of the vertex.
- The y-intercept is \((0, c)\). Find x-intercepts by factoring or the quadratic formula.
- Plot the vertex, the intercepts, and symmetric points, then draw a smooth curve.
Example: For \(y = x^{2} – 4x + 3\), the axis is \(x = 2\), the vertex is \((2, -1)\), the y-intercept is 3, and the x-intercepts are 1 and 3.
What does vertex form tell you?
In \(f(x) = a(x – h)^{2} + k\), the vertex is \((h, k)\), the axis is \(x = h\), and \(a\) controls the width and direction. Completing the square turns standard form into vertex form: \(x^{2} + 6x + 5\) becomes \((x + 3)^{2} – 4\).
How do transformations change the graph?
Starting from \(f(x) = x^{2}\): adding \(k\) shifts the graph up (positive) or down (negative); replacing \(x\) by \(x – h\) shifts it right when \(h\) is positive; multiplying by \(a\) stretches it, and a negative \(a\) reflects it over the x-axis.
For a quadratic model, the vertex gives the best value. If \(R = -5p^{2} + 100p\) is revenue, the vertex \((10, 500)\) gives the price that earns the most.
Tip: To sketch a parabola quickly, plot the vertex first, then two points on each side at equal distances from the axis of symmetry.
Quadratic functions lesson: questions and answers
How do you find the vertex of a parabola?
Use x = -b/(2a) for the x-coordinate, then substitute into the function for the y-coordinate. For y = x² – 4x + 3, x = 2 and y = -1.
What is the axis of symmetry?
It is the vertical line through the vertex, x = -b/(2a). The two halves of the parabola are mirror images across it.
How do you know if a parabola opens up or down?
Look at the sign of a. If a is positive it opens up; if a is negative it opens down.
What does (x – 2)² do to the graph of y = x²?
It shifts the graph 2 units to the right. A common mistake is to shift left because of the minus sign.
How can you find the maximum of a quadratic model?
Find the vertex. If the parabola opens down, the y-coordinate of the vertex is the maximum value.
How to use this quadratic functions lesson
Read the definitions first, then follow the worked method line by line and redo the example on paper without looking. When every step makes sense, move on to the worksheet, then check yourself with the quiz.
Download the quadratic functions lesson as a PDF with the button below and keep it with your notes.
All Algebra 1 chapters: Algebra 1 math.
Print this page
Download PDFDownload the Algebra 1 Graphing Quadratic Functions and Transformations Lesson (PDF, 74 KB)More Algebra 1 math
Lessons
See all





Worksheets
See all





Tests
See all Adding, Subtracting and Multiplying Polynomials Test with Point Values
- Linear Inequalities in One Variable Test with Point Values
- Linear Inequalities in Two Variables and Systems Test with Point Values
- Literal Equations and Formulas Test with Point Values
- Scatter Plots, Lines of Fit and Two-Way Tables Test with Point Values
- Solving Quadratic Equations Test with Point Values