Algebra 1 Scatter Plots, Lines of Fit and Two-Way Tables Test with Point Values (PDF)

This algebra 1 scatter plots test for Algebra 1 covers scatter plots, lines of fit and two-way tables (Common Core S-ID.B.5, S-ID.B.6, S-ID.C.7, S-ID.C.8, S-ID.C.9), with a free PDF to print.
Time and points
- Grade: Algebra 1
- Chapter: Scatter Plots, Lines of Fit and Two-Way Tables
- Standards: S-ID.B.5, S-ID.B.6, S-ID.C.7, S-ID.C.8, S-ID.C.9
- Time: 45 minutes
- Total: 20 points
Algebra 1 scatter plots test: questions
Question 1 – Describe the association [2 pts]
The scatter plot shows weeks of training and push-ups completed. Describe the direction and the strength of the association.
Question 2 – Write the line of fit [2 pts]
A line of fit passes through \((1, 12)\) and \((6, 32)\). Write its equation in slope-intercept form.
Question 3 – Interpret the model [2 pts]
In \(y = 4x + 8\), \(x\) is the number of weeks of training and \(y\) is the number of push-ups. Interpret the slope and the y-intercept.
Question 4 – Predict and find a residual [2 pts]
Use \(y = 4x + 8\) to predict the push-ups after 3 weeks. A student actually did 23. Find the residual.
Question 5 – Correlation coefficient [2 pts]
Describe each correlation coefficient: (a) \(r = -0.88\) (b) \(r = 0.2\).
Question 6 – Causation [2 pts]
Data show that cities with more fire trucks have more fire damage. Does this mean fire trucks cause more damage? Explain.
Question 7 – Two-way table [3 pts]
One hundred students chose pizza or tacos for lunch.
- Find the joint relative frequency of grade 7 students who chose tacos. (1 point)
- Find the marginal relative frequency of students who chose pizza. (1 point)
- Among grade 6 students, what percent chose pizza? (1 point)
Question 8 – Residuals [3 pts]
The line of fit for the data \((1, 4), (2, 4), (3, 9)\) is \(y = 2x + 1\).
- Find the predicted value for each point. (1 point)
- Find each residual. (1 point)
- Which point is farthest from the line? (1 point)
Question 9 – Extrapolation [2 pts]
A line of fit \(y = 0.5x + 10\) was found from data with \(x\) between 20 and 60. Is it reasonable to predict at \(x = 40\)? At \(x = 200\)? Explain.

Key facts behind this algebra 1 scatter plots test
- A scatter plot can show positive, negative, or no association.
- In a line of best fit, the slope is the rate of change and the intercept is the predicted value at x = 0.
- Residual = actual value – predicted value.
- The correlation coefficient r is between -1 and 1; correlation does not imply causation.
- Two-way tables give joint, marginal, and conditional relative frequencies.
How to use this algebra 1 scatter plots test
Time yourself: the test is designed for an average student in 45 minutes. Answer the questions you are sure of first, then come back to the longer ones and check your units.
All Algebra 1 chapters: Algebra 1 math.
Free printable PDF
Algebra 1 Scatter Plots, Lines of Fit and Two-Way Tables Test with Point Values
Download PDF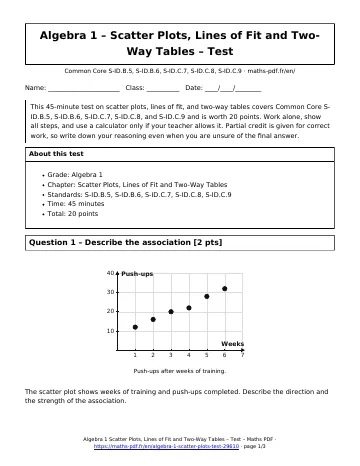
More Algebra 1 math
Lessons
See all





Worksheets
See all





Tests
See all Graphing Linear Equations Test with Point Values
- Exponent Rules and Radicals Test with Point Values
- Functions and Function Notation Test with Point Values
- Exponential Functions and Growth Test with Point Values
- Data Distributions and Summary Statistics Test with Point Values
- Graphing Quadratic Functions and Transformations Test with Point Values