Algebra 1 Scatter Plots, Lines of Fit and Two-Way Tables Test Solutions and Scoring (PDF)

This algebra 1 scatter plots test answers for Algebra 1 covers scatter plots, lines of fit and two-way tables (Common Core S-ID.B.5, S-ID.B.6, S-ID.C.7, S-ID.C.8, S-ID.C.9), with a free PDF to print.
Algebra 1 · Common Core State Standards: S-ID.B.5, S-ID.B.6, S-ID.C.7, S-ID.C.8, S-ID.C.9
Algebra 1 scatter plots test answers: worked solutions
Question 1 – Describe the association [2 pts]
The points rise from left to right and lie close to a line.
Strong positive association
Scoring: 1 point for the direction; 1 point for the strength.
Question 2 – Write the line of fit [2 pts]
Slope: \(\frac{32 – 12}{6 – 1} = 4\). Then \(12 = 4(1) + b\), so \(b = 8\).
\(y = 4x + 8\)
Scoring: 1 point for the slope; 1 point for the equation.
Question 3 – Interpret the model [2 pts]
Slope 4: the model predicts 4 more push-ups for each additional week.
Intercept 8: the predicted number of push-ups before training begins (0 weeks).
4 push-ups per week; 8 at the start
Scoring: 1 point for each interpretation in context.
Question 4 – Predict and find a residual [2 pts]
Predicted: \(4(3) + 8 = 20\). Residual: \(23 – 20 = 3\).
Predicted 20; residual 3
Scoring: 1 point for the prediction; 1 point for the residual.
Question 5 – Correlation coefficient [2 pts]
(a) Close to -1: a strong negative linear relationship.
(b) Close to 0: a weak positive linear relationship.
strong negative; weak positive
Scoring: 1 point for each description.
Question 6 – Causation [2 pts]
No. Larger fires lead to more fire trucks being sent, and larger fires cause more damage. The size of the fire is a lurking variable, so the correlation does not show causation.
Scoring: 1 point for answering no; 1 point for a lurking variable explanation.
Question 7 – Two-way table [3 pts]
a) \(\frac{40}{100} = 40\%\).
b) \(\frac{50}{100} = 50\%\).
c) \(\frac{30}{40} = 75\%\).
40%; 50%; 75%
Scoring: 1 point per part.
Question 8 – Residuals [3 pts]
a) Predicted: \(3, 5, 7\).
b) Residuals: \(4 – 3 = 1\), \(4 – 5 = -1\), \(9 – 7 = 2\).
c) The largest absolute residual is 2, at \((3, 9)\).
3, 5, 7; 1, -1, 2; (3, 9)
Scoring: 1 point per part.
Question 9 – Extrapolation [2 pts]
At \(x = 40\): \(0.5(40) + 10 = 30\), which is within the data range, so it is reasonable (interpolation).
At \(x = 200\): this is far outside the data (extrapolation), so the prediction may not be reliable.
x = 40 reasonable (30); x = 200 unreliable
Scoring: 1 point for each correct judgment with a reason.
Total score
20 points
Key facts behind this algebra 1 scatter plots test answers
- A scatter plot can show positive, negative, or no association.
- In a line of best fit, the slope is the rate of change and the intercept is the predicted value at x = 0.
- Residual = actual value – predicted value.
- The correlation coefficient r is between -1 and 1; correlation does not imply causation.
- Two-way tables give joint, marginal, and conditional relative frequencies.
How to use this algebra 1 scatter plots test answers
Score your test with the point values shown for each question. Then read the worked solution of every question where you lost points and note the method to review.
All Algebra 1 chapters: Algebra 1 math.
Free printable PDF
Algebra 1 Scatter Plots, Lines of Fit and Two-Way Tables Test Solutions and Scoring
Download PDF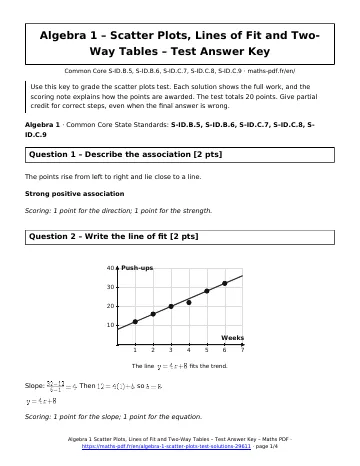
More Algebra 1 math
Lessons
See all





Worksheets
See all





Tests
See all Scatter Plots, Lines of Fit and Two-Way Tables Test with Point Values
- Structure of Algebraic Expressions Test with Point Values
- Graphing Linear Equations Test with Point Values
- Exponential Functions and Growth Test with Point Values
- Adding, Subtracting and Multiplying Polynomials Test with Point Values
- Slope and Rate of Change Test with Point Values