Algebra 1 Data Distributions and Summary Statistics Test Solutions and Scoring (PDF)

This data distributions test answers for Algebra 1 covers data distributions and summary statistics (Common Core S-ID.A.1, S-ID.A.2, S-ID.A.3), with a free PDF to print.
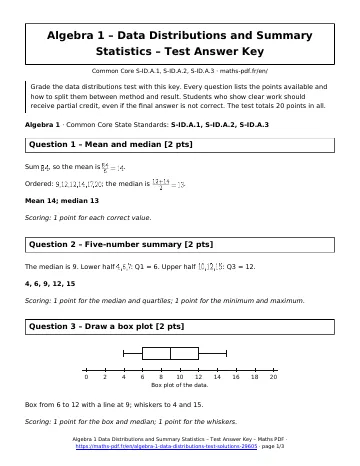
Algebra 1 · Common Core State Standards: S-ID.A.1, S-ID.A.2, S-ID.A.3
Data distributions test answers: worked solutions
Question 1 – Mean and median [2 pts]
Sum \(84\), so the mean is \(\frac{84}{6} = 14\).
Ordered: \(9, 12, 12, 14, 17, 20\); the median is \(\frac{12 + 14}{2} = 13\).
Mean 14; median 13
Scoring: 1 point for each correct value.
Question 2 – Five-number summary [2 pts]
The median is 9. Lower half \(4, 6, 7\): Q1 = 6. Upper half \(10, 12, 15\): Q3 = 12.
4, 6, 9, 12, 15
Scoring: 1 point for the median and quartiles; 1 point for the minimum and maximum.
Question 3 – Draw a box plot [2 pts]
Box from 6 to 12 with a line at 9; whiskers to 4 and 15.
Scoring: 1 point for the box and median; 1 point for the whiskers.
Question 4 – Outlier test [2 pts]
\(Q1 = 22.5\), \(Q3 = 27.5\), \(\text{IQR} = 5\). Upper fence: \(27.5 + 1.5(5) = 35\).
60 is above 35, so it is an outlier
Scoring: 1 point for the IQR and fence; 1 point for the conclusion.
Question 5 – Read a histogram [2 pts]
\(4 + 9 = 13\) students. \(\frac{13}{20} = 65\%\).
13 students; 65%
Scoring: 1 point for the count; 1 point for the percent.
Question 6 – Standard deviation [2 pts]
Mean 5. Squared deviations sum to 32. Variance \(\frac{32}{8} = 4\).
\(\sigma = 2\)
Scoring: 1 point for the mean and squared deviations; 1 point for the standard deviation.
Question 7 – Compare two groups [3 pts]
a) A: \(12 – 8 = 4\). B: \(15 – 5 = 10\).
b) Group B has the larger standard deviation.
c) The values in B vary more, while the values in A are closer to the mean of 10.
Ranges 4 and 10; B more spread out
Scoring: 1 point per part.
Question 8 – Commute times [3 pts]
a) The median is 18 minutes.
b) \(25 – 12 = 13\).
c) Upper fence: \(25 + 1.5(13) = 44.5\). Since 50 is greater than 44.5, it is an outlier.
18; 13; yes
Scoring: 1 point per part.
Question 9 – Choose a measure [2 pts]
Mean: \(\frac{372}{7} \approx 53.1\). Median: 38.
The salary 150 is an outlier that pulls the mean up, so the median describes a typical salary better.
Mean about $53,100; median $38,000; use the median
Scoring: 1 point for both values; 1 point for the choice with an explanation.
Total score
20 points
Key facts behind this data distributions test answers
- Dot plots show every value; histograms group data into intervals; box plots show five numbers.
- Mean = sum ÷ count; median = middle value.
- IQR = Q3 – Q1; range = maximum – minimum.
- Outlier rule: below Q1 – 1.5·IQR or above Q3 + 1.5·IQR.
- With outliers or skew, the median and IQR are better summaries than the mean and standard deviation.
How to use this data distributions test answers
Score your test with the point values shown for each question. Then read the worked solution of every question where you lost points and note the method to review.
All Algebra 1 chapters: Algebra 1 math.
Print this page
Download PDFDownload the Algebra 1 Data Distributions and Summary Statistics Test Solutions and Scoring (PDF, 88 KB)More Algebra 1 math
Lessons
See all





Worksheets
See all





Tests
See all Linear Inequalities in Two Variables and Systems Test with Point Values
- Exponential Functions and Growth Test with Point Values
- Systems of Linear Equations Test with Point Values
- Functions and Function Notation Test with Point Values
- Data Distributions and Summary Statistics Test with Point Values
- Arithmetic and Geometric Sequences Test with Point Values