Algebra 1 Data Distributions and Summary Statistics Test with Point Values (PDF)

This data distributions test for Algebra 1 covers data distributions and summary statistics (Common Core S-ID.A.1, S-ID.A.2, S-ID.A.3), with a free PDF to print.
Time and points
- Grade: Algebra 1
- Chapter: Data Distributions and Summary Statistics
- Standards: S-ID.A.1, S-ID.A.2, S-ID.A.3
- Time: 45 minutes
- Total: 20 points
Data distributions test: questions
Question 1 – Mean and median [2 pts]
Find the mean and the median of \(14, 9, 12, 17, 20, 12\).
Question 2 – Five-number summary [2 pts]
Find the five-number summary of \(4, 6, 7, 9, 10, 12, 15\).
Question 3 – Draw a box plot [2 pts]
Draw a box plot for the five-number summary: minimum 4, Q1 6, median 9, Q3 12, maximum 15.
Question 4 – Outlier test [2 pts]
The data are \(20, 22, 23, 25, 26, 27, 28, 60\). Use the \(1.5 \cdot \text{IQR}\) rule to decide whether 60 is an outlier.
Question 5 – Read a histogram [2 pts]
The histogram shows the walking times of 20 students. How many students walk less than 10 minutes, and what percent of the 20 is that?
Question 6 – Standard deviation [2 pts]
Find the standard deviation of \(2, 4, 4, 4, 5, 5, 7, 9\). Divide by \(n\).
Question 7 – Compare two groups [3 pts]
Two groups have the data shown in the table. Both have a mean of 10.
- Find the range of each group. (1 point)
- The standard deviations are about 1.3 for A and 3.4 for B. Which group is more spread out? (1 point)
- What does this mean about the groups? (1 point)
Question 8 – Commute times [3 pts]
The box plot shows commute times (minutes) for a class.
- What is the median? (1 point)
- Find the IQR. (1 point)
- Is 50 minutes an outlier? Use the 1.5·IQR rule. (1 point)
Question 9 – Choose a measure [2 pts]
The salaries (in thousands of dollars) of seven employees are \(32, 35, 36, 38, 40, 41, 150\). Find the mean and median. Which better describes a typical salary? Explain.

Key facts behind this data distributions test
- Dot plots show every value; histograms group data into intervals; box plots show five numbers.
- Mean = sum ÷ count; median = middle value.
- IQR = Q3 – Q1; range = maximum – minimum.
- Outlier rule: below Q1 – 1.5·IQR or above Q3 + 1.5·IQR.
- With outliers or skew, the median and IQR are better summaries than the mean and standard deviation.
How to use this data distributions test
Time yourself: the test is designed for an average student in 45 minutes. Answer the questions you are sure of first, then come back to the longer ones and check your units.
All Algebra 1 chapters: Algebra 1 math.
Free printable PDF
Algebra 1 Data Distributions and Summary Statistics Test with Point Values
Download PDF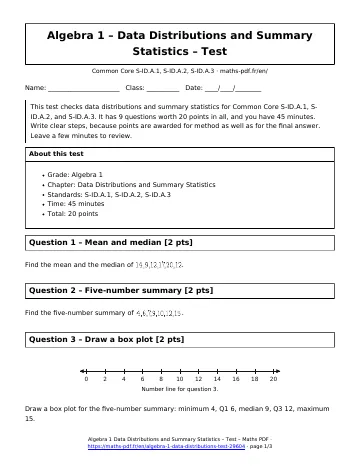
More Algebra 1 math
Lessons
See all





Worksheets
See all





Tests
See all Graphing Quadratic Functions and Transformations Test with Point Values
- Scatter Plots, Lines of Fit and Two-Way Tables Test with Point Values
- Literal Equations and Formulas Test with Point Values
- Functions and Function Notation Test with Point Values
- Structure of Algebraic Expressions Test with Point Values
- Linear Inequalities in Two Variables and Systems Test with Point Values