
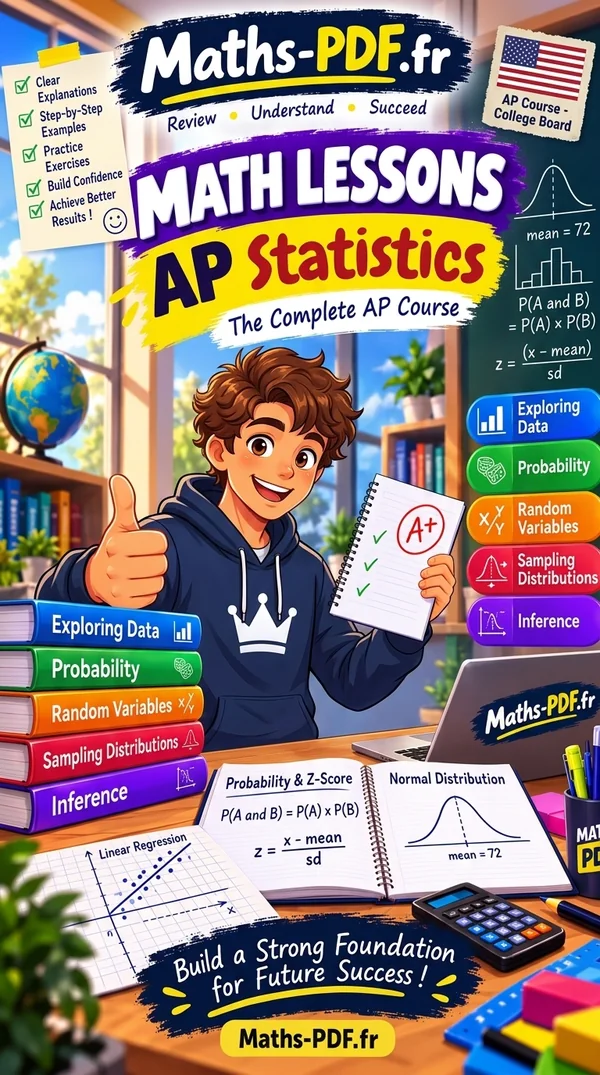
AP Statistics Math Lessons
The AP Statistics course in 22 lessons, from Variables and Categorical Data Displays to Inference for the Slope of a Regression Line, each one with its Key facts and a closing set of questions and answers.
- 84 US Letter pages
- 22 chapters
- 104 lesson sections
- PDF to print
- Cards accepted without a PayPal account
- Instant download, up to 3 devices
About this book
AP Statistics teaches how to reason with data. The lessons begin with variables, graphs and summary statistics, then cover correlation, least-squares regression and residuals, sampling methods, probability and random variables.
Every chapter opens with the skills it builds; in Confidence Intervals for a Proportion, for instance: understand a confidence interval, build and check the interval, interpret the interval and the confidence level. A Key facts box sums up what to remember. Most of the 104 lesson sections of the book are written as questions a student would ask, such as How do you build and check the interval?
For an AP Statistics student, a parent, or a teacher looking for chapter tests. Pair it with the AP Statistics Math Worksheets with Answers to practice each chapter right after reading it.
Detailed contents
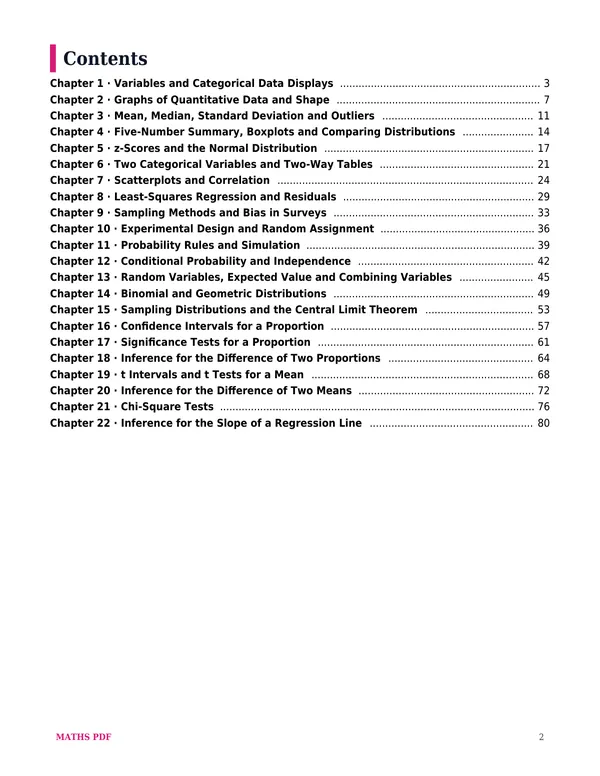
The 22 chapters of the AP Statistics lesson book, the sections of each lesson and the page where each chapter starts.
-
1
Variables and Categorical Data Displays
- What are individuals and variables?
- How do you display a categorical distribution?
- When should you use a bar graph or a pie chart?
- How do you compare two categorical distributions?
- Categorical data lesson: questions and answers
-
2
Graphs of Quantitative Data and Shape
- How do you display a quantitative variable?
- What do you say when you describe a distribution?
- How do you tell skewed from symmetric?
- Quantitative graphs lesson: questions and answers
-
3
Mean, Median, Standard Deviation and Outliers
- What are the mean and the median?
- How do you measure spread?
- How do you decide whether a value is an outlier?
- What happens when you change units?
- Summary statistics lesson: questions and answers
-
4
Five-Number Summary, Boxplots and Comparing Distributions
- What is the five-number summary?
- How do you draw a boxplot?
- How do you compare distributions?
- How do you read skew and outliers in a boxplot?
- Boxplots compare lesson: questions and answers
-
5
z-Scores and the Normal Distribution
- What is a z-score?
- What is the normal distribution?
- How do you find a normal probability?
- How do you work backward from a percentile?
- Ap statistics normal distribution lesson: questions and answers
-
6
Two Categorical Variables and Two-Way Tables
- How do you organize two categorical variables?
- What are marginal, joint, and conditional relative frequencies?
- How do you decide whether two variables are associated?
- Why can a table mislead?
- Two categorical lesson: questions and answers
-
7
Scatterplots and Correlation
- What is a scatterplot?
- How do you describe a scatterplot?
- What is the correlation coefficient?
- What can go wrong with correlation?
- Scatterplots correlation lesson: questions and answers
-
8
Least-Squares Regression and Residuals
- What is the least-squares regression line?
- How do you interpret the slope and intercept?
- What is a residual?
- How do you measure how well the line fits?
- Regression residuals lesson: questions and answers
-
9
Sampling Methods and Bias in Surveys
- What are populations, samples, parameters, and statistics?
- What are the main random sampling methods?
- What causes bias?
- How do you select a simple random sample with random digits?
- Sampling methods lesson: questions and answers
-
10
Experimental Design and Random Assignment
- What is the difference between an observational study and an experiment?
- What makes a good experiment?
- What are the common experimental designs?
- What can you conclude?
- Experiments lesson: questions and answers
-
11
Probability Rules and Simulation
- What does probability mean?
- How do you estimate probabilities with a simulation?
- What are the basic probability rules?
- When should you use the complement?
- How do Venn diagrams help?
- Probability simulation lesson: questions and answers
-
12
Conditional Probability and Independence
- What is conditional probability?
- What is the general multiplication rule?
- What does independence mean?
- Conditional probability lesson: questions and answers
-
13
Random Variables, Expected Value and Combining Variables
- What is a discrete random variable?
- How do you find the mean and standard deviation of a random variable?
- How do transformations and combinations change a random variable?
- Random variables lesson: questions and answers
-
14
Binomial and Geometric Distributions
- What is a binomial distribution?
- How do you compute binomial probabilities?
- What is a geometric distribution?
- Binomial geometric lesson: questions and answers
-
15
Sampling Distributions and the Central Limit Theorem
- What is a sampling distribution?
- What is the sampling distribution of a sample proportion?
- What is the central limit theorem?
- How do differences behave?
- Sampling distributions lesson: questions and answers
-
16
Confidence Intervals for a Proportion
- What is a confidence interval?
- How do you build and check the interval?
- How do you interpret the interval and the confidence level?
- Confidence interval proportion lesson: questions and answers
-
17
Significance Tests for a Proportion
- What is a significance test?
- How do you compute the test statistic and p-value?
- How do you reach a conclusion?
- What are Type I and Type II errors?
- Test proportion lesson: questions and answers
-
18
Inference for the Difference of Two Proportions
- What does inference about two proportions compare?
- How do you build a confidence interval for p1 - p2?
- How do you test H0: p1 = p2?
- Two proportions lesson: questions and answers
-
19
t Intervals and t Tests for a Mean
- Why use the t distribution?
- How do you build and check a one-sample t interval?
- How do you carry out a one-sample t test?
- What about matched pairs?
- Inference one mean lesson: questions and answers
-
20
Inference for the Difference of Two Means
- What do we compare with two means?
- How do you build a two-sample t interval?
- How do you test H0: mu1 = mu2?
- When is a paired procedure needed?
- Two means lesson: questions and answers
-
21
Chi-Square Tests
- What is a chi-square test?
- How does a goodness-of-fit test work?
- How do you test two categorical variables?
- Chi square lesson: questions and answers
-
22
Inference for the Slope of a Regression Line
- What does inference about a slope tell us?
- What conditions are needed?
- How do you build a t interval for the slope?
- How do you test whether there is a linear relationship?
- Inference slope lesson: questions and answers
Sample pages
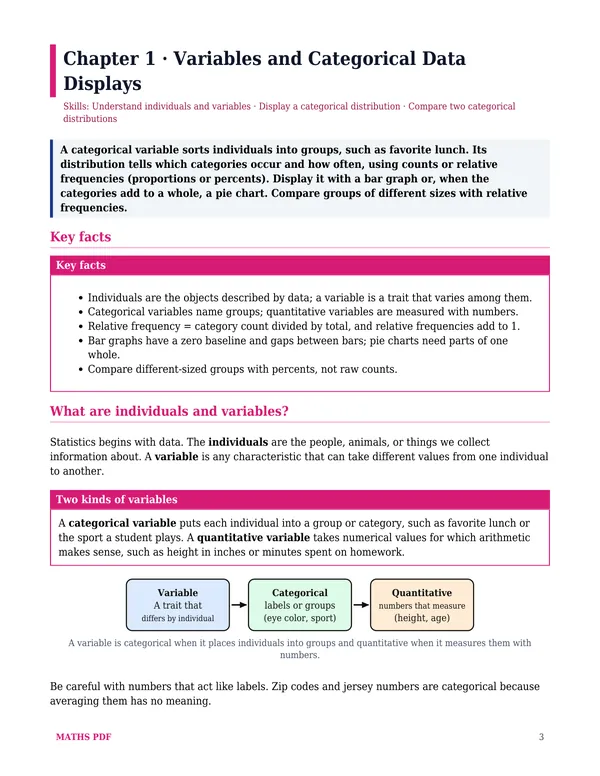
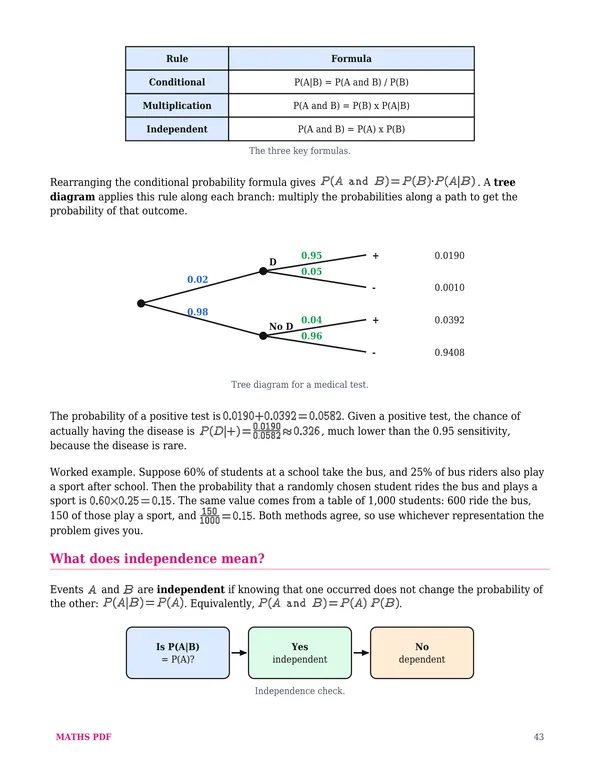
Three pages from the AP Statistics Math Lessons, exactly as you will print them. Click to enlarge.
How to use this lesson book
Read one chapter at a time
The 22 chapters follow the order of the AP Statistics course; at about 4 pages each, a chapter is one short sitting.
Copy the key facts
Write the Key facts of t Intervals and t Tests for a Mean on an index card: a ready-made summary for the night before a quiz.
Try the closing questions
Cover the answers at the end of Variables and Categorical Data Displays and answer first: the best way to check understanding.


Frequently asked questions
What is in the AP Statistics lesson book?
84 US Letter pages and 22 chapters, one lesson per chapter, with 104 lesson sections in all. The full contents are listed above on this page.
Does the AP Statistics lesson book include exercises?
Each chapter ends with a short set of questions and answers. For full practice, the AP Statistics Math Worksheets with Answers follows the same 22 chapters.
Do I need the AP Statistics Math Worksheets with Answers along with the lesson book?
No, the AP Statistics Math Lessons stands on its own. But both books follow the same 22 chapters of AP Statistics; together they make a complete course, lesson then practice.
How do I receive the AP Statistics Math Lessons?
Right after paying with PayPal or a card, you reach your download page, where the AP Statistics Math Lessons is waiting. An email with the link is sent too.
Can I print the AP Statistics lesson book and open it on several devices?
Yes: the 84-page PDF of the AP Statistics Math Lessons prints as often as you need and opens on three devices (computer, tablet, phone). It carries your name at the bottom of the pages.
More answers on the shop page, or through our contact form.