
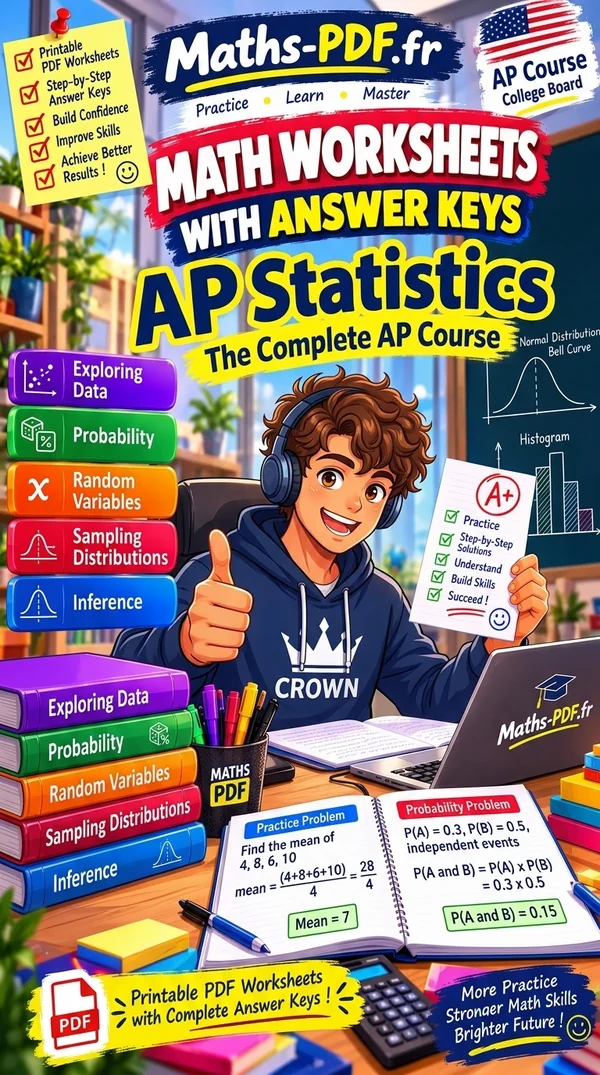
AP Statistics Math Worksheets with Answers
440 exercises on the 22 chapters of AP Statistics, from Variables and Categorical Data Displays to Inference for the Slope of a Regression Line, and in Part 2 a worked answer for every one of them.
- 234 US Letter pages
- 22 chapters
- 440 exercises with answers
- PDF to print
- Cards accepted without a PayPal account
- Instant download, up to 3 devices
About this book
The workbook practices every chapter of the course, including two-way tables, experimental design and random assignment, sampling distributions, confidence intervals for a proportion and t intervals for a mean.
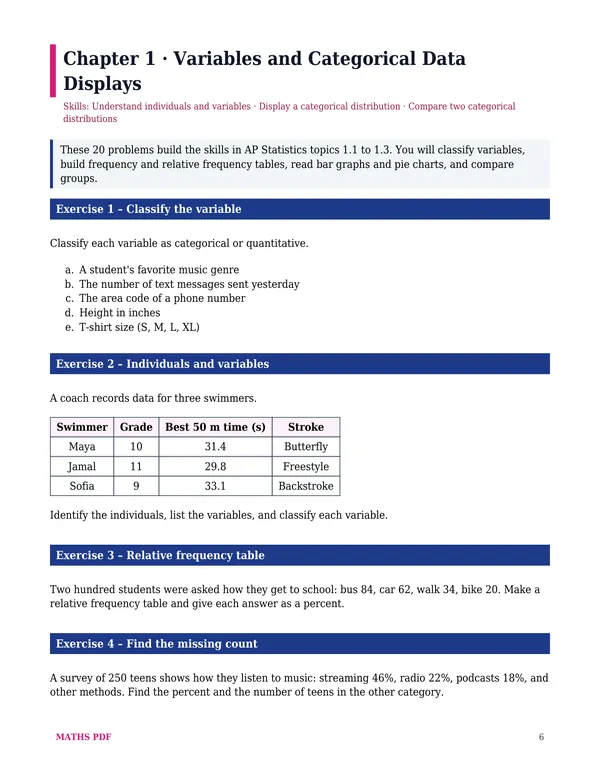
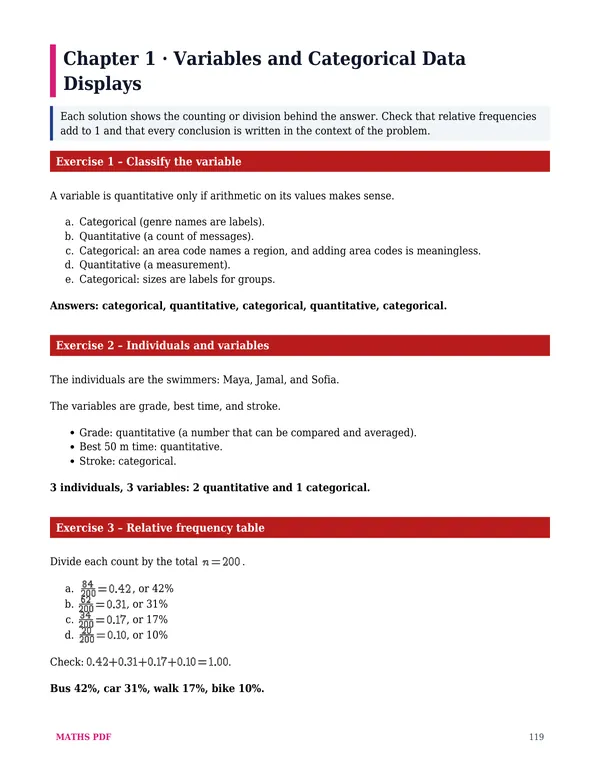
Part 1 holds the worksheets, about 20 exercises per chapter, each with a short title that says what it practices, like Increase power in Significance Tests for a Proportion. Part 2, which starts on page 118, gives the answers in the same order, so checking takes a minute.
For an AP Statistics student, a parent, or a teacher looking for chapter tests. Pair it with the AP Statistics Math Lessons to go back to the lesson when a problem gets stuck.
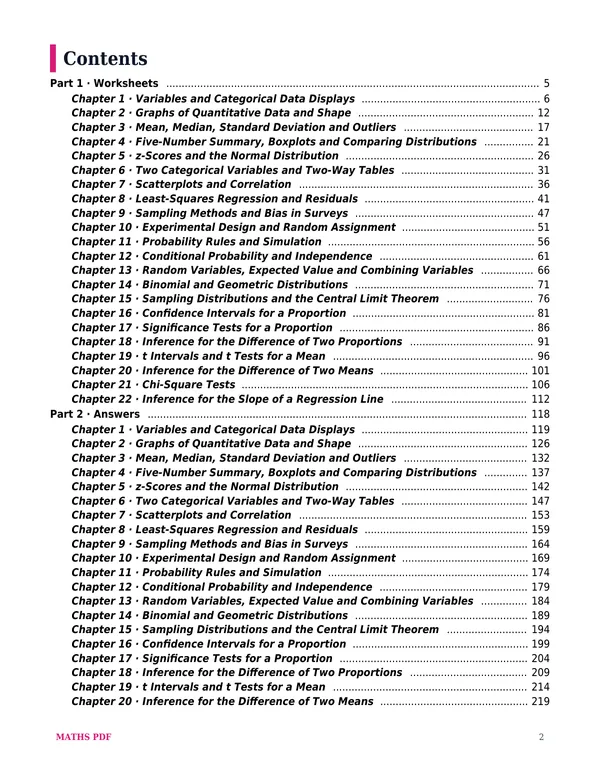
Detailed contents
The 22 chapters of the AP Statistics workbook, the number of exercises in each, and the titles of the first ones.
-
1
Variables and Categorical Data Displays
- Classify the variable
- Individuals and variables
- Relative frequency table
- Find the missing count
- Read a bar graph
- Pie chart angles
-
2
Graphs of Quantitative Data and Shape
- Read a dotplot
- Unusual feature
- Build a stemplot
- Read a histogram
- Why do the bars touch?
- Name the shape
-
3
Mean, Median, Standard Deviation and Outliers
- Compute a mean
- Median of an odd list
- Median of an even list
- Find the missing value
- Range and IQR
- Standard deviation by hand
-
4
Five-Number Summary, Boxplots and Comparing Distributions
- Five-number summary
- Read a boxplot
- Draw a boxplot
- Outliers and whiskers
- Quarters of the data
- Compare in context
-
5
z-Scores and the Normal Distribution
- Compute a z-score
- Value from a z-score
- Compare two scores
- Empirical rule
- Empirical rule counts
- Area to the left
-
6
Two Categorical Variables and Two-Way Tables
- Explanatory and response
- Complete the table
- Marginal relative frequency
- Joint relative frequency
- Conditional given a column
- Conditional given a row
-
7
Scatterplots and Correlation
- Explanatory and response
- Describe a scatterplot
- Direction and form
- Match r to the plot
- Compute r by hand
- Interpret r
-
8
Least-Squares Regression and Residuals
- Predict
- Interpret the slope
- Interpret the intercept
- Compute a residual
- Find the slope and intercept
- Point of means
-
9
Sampling Methods and Bias in Surveys
- Population, sample, statistic
- Parameter or statistic?
- Name the sampling method
- SRS with random digits
- Systematic sample
- Stratified allocation
-
10
Experimental Design and Random Assignment
- Study or experiment?
- Name the parts
- Confounding
- Placebo and blinding
- Random assignment
- Completely randomized design
-
11
Probability Rules and Simulation
- Interpret a probability
- Law of large numbers
- Gambler's fallacy
- Equally likely outcomes
- Sample space of two coins
- Two dice
-
12
Conditional Probability and Independence
- Conditional from a table
- Use the formula
- General multiplication rule
- Tree diagram
- Reverse conditional
- Independence check
-
13
Random Variables, Expected Value and Combining Variables
- Valid distribution?
- Missing probability
- Find a probability
- Expected value
- Interpret the mean
- Standard deviation
-
14
Binomial and Geometric Distributions
- Check BINS
- Binomial formula
- binompdf
- binomcdf
- At least
- Between
-
15
Sampling Distributions and the Central Limit Theorem
- Parameter or statistic
- Sampling variability
- Mean and SD of p-hat
- Check conditions
- Probability for p-hat
- Effect of sample size
-
16
Confidence Intervals for a Proportion
- Critical values
- Check conditions
- Compute an interval
- Interpret the interval
- Interpret the confidence level
- Identify errors
-
17
Significance Tests for a Proportion
- Write hypotheses
- Check conditions
- Compute z
- Find the p-value
- Conclude
- Interpret a p-value
-
18
Inference for the Difference of Two Proportions
- State the parameters
- Check conditions
- Difference and standard error
- Confidence interval
- Interpret the interval
- 90 percent interval
-
19
t Intervals and t Tests for a Mean
- t versus normal
- Degrees of freedom and t*
- Standard error
- Compute an interval
- Interpret the interval
- Check the Normal condition
-
20
Inference for the Difference of Two Means
- Parameters and hypotheses
- Difference and standard error
- Degrees of freedom
- Confidence interval
- Interpret the interval
- Check conditions
-
21
Chi-Square Tests
- Expected counts for GOF
- Degrees of freedom
- Compute chi-square
- p-value
- Largest contribution
- Hypotheses
-
22
Inference for the Slope of a Regression Line
- Parameters
- LINER conditions
- Residual plot
- Read the output
- Interpret the slope
- Degrees of freedom and t*
Sample pages
Three pages from the AP Statistics Math Worksheets with Answers, exactly as you will print them. Click to enlarge.
How to use this workbook
Try before you check
Work on Homework hours on scratch paper before opening Part 2: that is where progress happens.
Use the numbering
Answers carry the same chapter and exercise numbers as the 22 AP Statistics worksheets, so the right one is easy to find.
Target one chapter
Before a quiz on Graphs of Quantitative Data and Shape, do its 20 exercises, then redo the ones you missed.


Frequently asked questions
How many exercises are in the AP Statistics workbook?
440 exercises on 234 pages, spread over 22 chapters. Each one has its answer in Part 2.
Where are the answers of the AP Statistics worksheets?
In Part 2, at the end of the AP Statistics workbook, starting on page 118. They are kept apart from the worksheets so a student can work without seeing them.
Do I need the AP Statistics Math Lessons along with the workbook?
No, the AP Statistics Math Worksheets with Answers stands on its own. But both books follow the same 22 chapters of AP Statistics; together they make a complete course, lesson then practice.
How do I receive the AP Statistics Math Worksheets with Answers?
Right after paying with PayPal or a card, you reach your download page, where the AP Statistics Math Worksheets with Answers is waiting. An email with the link is sent too.
Can I print the AP Statistics workbook and open it on several devices?
Yes: the 234-page PDF of the AP Statistics Math Worksheets with Answers prints as often as you need and opens on three devices (computer, tablet, phone). It carries your name at the bottom of the pages.
More answers on the shop page, or through our contact form.